

Nitrogen Data for Global Good: Building a Global Nitrogen Dataset to Inform Action
Nitrogen data are essential for understanding how the planet’s life-support systems function and how human activities reshape them. Nitrogen is fundamental to plant growth and food production, yet excess nitrogen from fertilizers, livestock, transportation, and industrial activities contributes to air and water pollution, biodiversity loss, and extreme weather events. Although nitrogen has been a subject of interest since the earliest stages of agricultural civilization, large uncertainties still remain in how we quantify and manage the global nitrogen cycle. These uncertainties limit our ability to optimize nitrogen use for both productivity and environmental sustainability. Furthermore, nitrogen interacts closely with other key biogeochemical cycles, including carbon and phosphorus, meaning that mismanagement of nitrogen can have cascading effects on soil health, plant growth, water quality, and climate regulation.
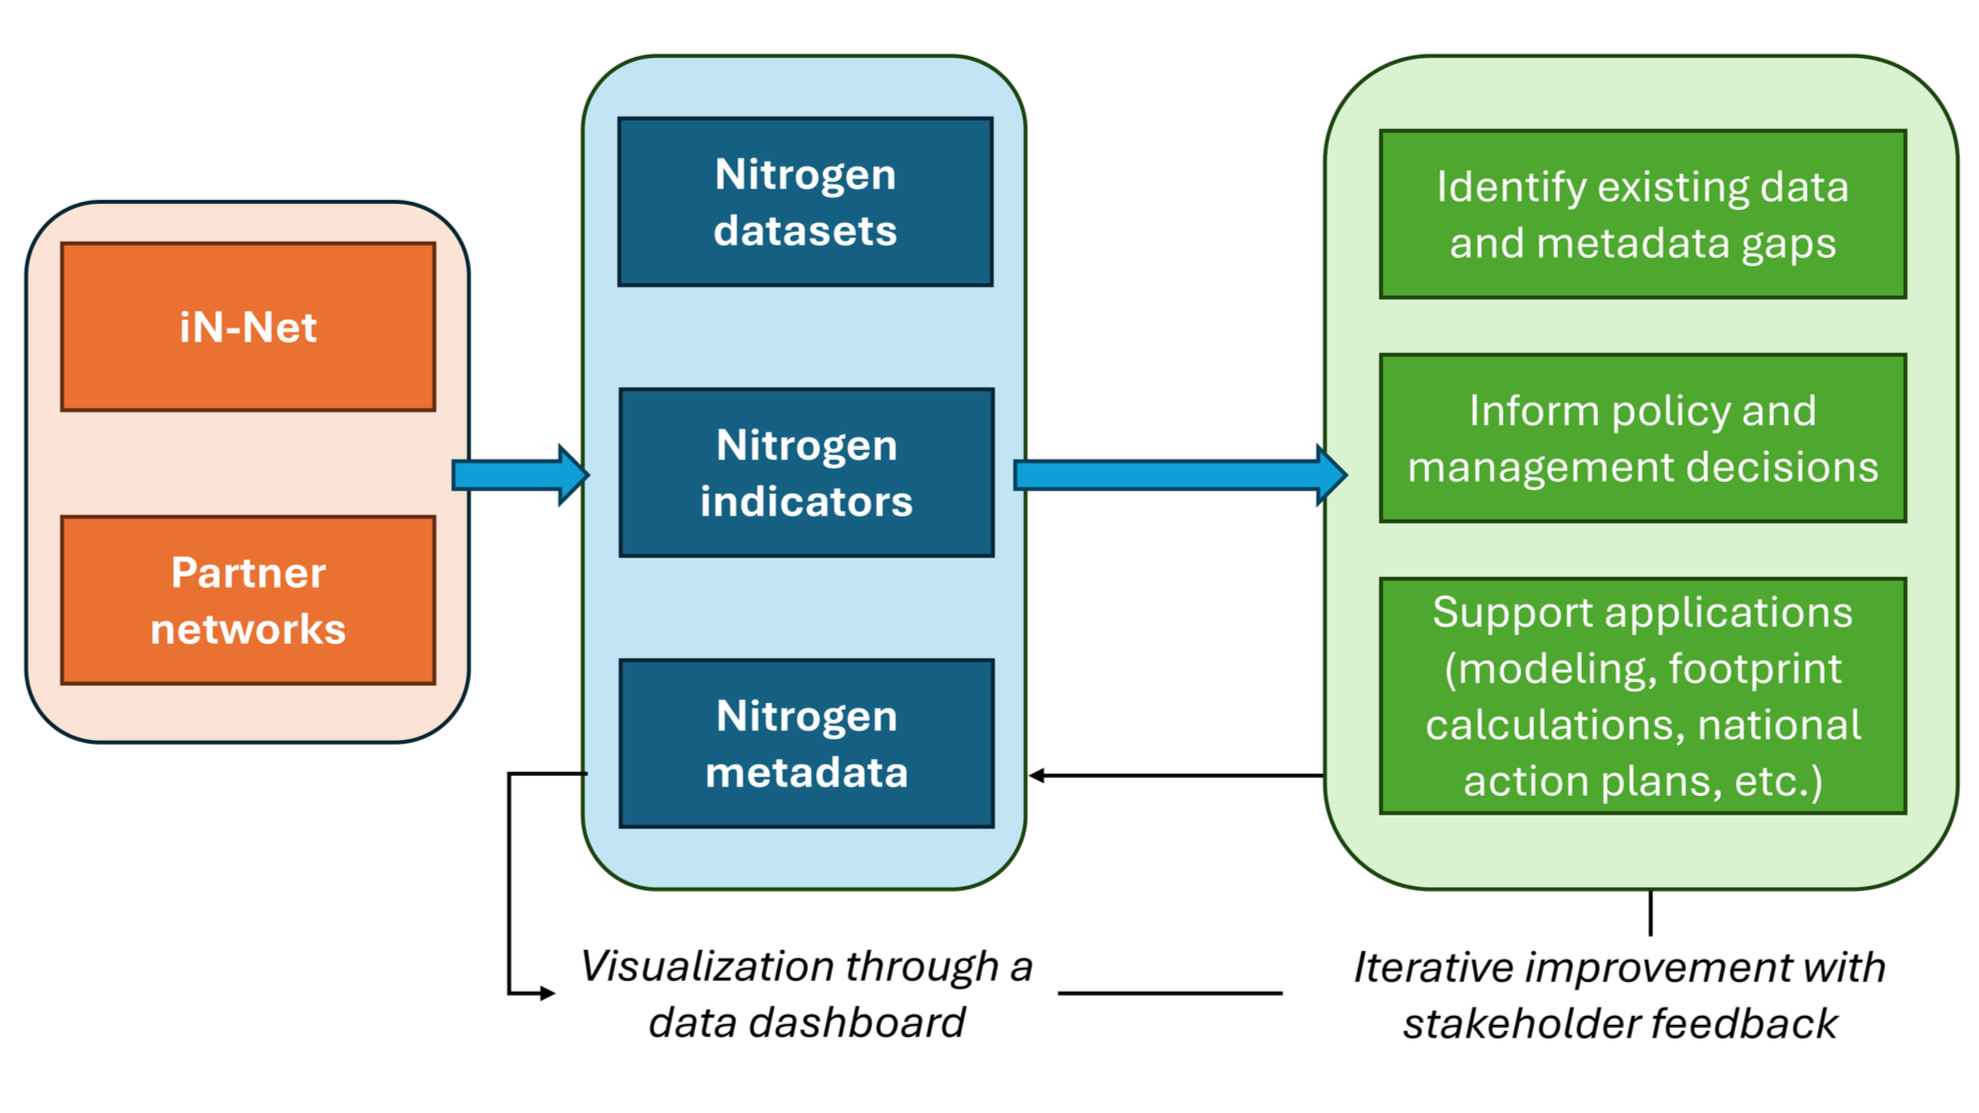
The International Nitrogen Network (iN-Net) and its partner networks are working together to close this gap. With more than 150 members and collaborators from research institutions, policy organizations, and stakeholder groups, iN-Net is compiling and harmonizing publicly available global datasets on nitrogen indicators. These indicators encompass multiple pathways, such as fertilizer and manure inputs, biological nitrogen fixation, nitrogen use efficiency and balance, gaseous emissions, and nitrogen losses to air and water. By curating datasets and their associated metadata across agricultural, industrial, and urban systems, iN-Net seeks to establish an open-source global nitrogen database for the global good. Importantly, this effort emphasizes transparency, reproducibility, collaboration, and open access, so that the data can be readily used by various user groups to support evidence-based decision-making.
This collective effort extends beyond scientific synthesis. The iN-Net Data Group, led by Dr. Peter Groffman from The City University of New York, is working to ensure that the database can facilitate consistent understanding, monitoring, and management of nitrogen flows, thereby providing a foundation for evidence-based management and policy decisions. The Working Group aims to build nitrogen datasets that support applications such as national action plans (NAPs), nitrogen footprint assessments, the evaluation of alternative and innovative practices, as well as the refinement of monitoring, measurement, and verification (MRV) and modeling frameworks, which can help countries and organizations track progress toward pollution reduction and climate goals. The database is anticipated to inform the development of decision-support tools for stakeholders, nitrogen footprint labels for consumers, and cross-sector assessments that connect nitrogen management with food security, ecosystem health, and greenhouse gas (GHG) mitigation. By linking nitrogen datasets to these applications, iN-Net seeks to bridge the gap between scientific knowledge and practical actions.
To advance these goals, the iN-Net Data Group has drawn inspiration from several successful initiatives. In one of our network presentations, Dr. Bill Bealey, an Ecologist from UK Centre for Ecology and Hydrology, introduced the International Nitrogen Management System (INMS), a developing international process under the International Nitrogen Initiative (INI) that provides science-based support for policymakers worldwide. The INMS process has been recognized under a UN Environment Assembly resolution and contributes to efforts such as the Nitrogen Budgets of the UN Economic Commission for Europe (UNECE) Task Force on Reactive Nitrogen. INMS has already developed spatially and temporally resolved datasets spanning topics such as agriculture, air pollution, greenhouse gases, biodiversity, and hydrology. These datasets include both measurements and model outputs generated under different scenarios and are accompanied by comprehensive metadata. An interactive nitrogen budget visualization tool has also been created, offering country-level estimates for nations such as Germany and Japan. The INMS database highlights the importance of collaboration across different nitrogen networks and serves as a model for the open-source product that iN-Net aims to develop and expand.
In another presentation, Dr. Kentaro Hayashi from the National Agriculture and Food Research Organization shared Japan’s experience in developing its NAP, which provides a national framework for coordinated nitrogen management and policy integration. The plan responds to increasing nitrogen waste and aligns with the principles of carbon neutrality, the circular economy, and a nature-positive future. The Japanese NAP represents the first national effort of its kind and has been rigorously designed to ensure coherence and integration within a unified framework. It aligns with international frameworks, establishes clear targets to track progress, prioritizes policies and resource allocation, strengthens data, knowledge, and technology exchange, enables stakeholder participation and legitimacy, and promotes global learning and cooperation. Dr. Hayashi emphasized that maintaining sustained government commitment to nitrogen management remains a key challenge, which requires institutional coordination, long-term investment, and continuous engagement across sectors.
We also heard from Leiden University’s Barent Baris, who works closely with Dr. James Galloway in designing a global nitrogen footprint tool, My N-Print. The motivation behind this tool is to provide consumers worldwide with a simple estimate of their nitrogen footprint. To achieve this, the tool uses global databases, including FAO food data and energy statistics, covering 183 countries. The My N-Print tool offers an introductory calculation that helps users understand what nitrogen pollution means and their personal contribution to it. The tool’s food module incorporates data on food supply, nitrogen removal rates, virtual nitrogen factors, and country income. The energy module uses data on carbon intensity of electricity generation, global energy consumption, national energy statistics, and global flight routes and flight numbers to estimate per capita nitrogen footprints. Some important application examples include ranking global nitrogen losses by food category and comparing dietary nitrogen efficiency across income groups. My N-Print is now available as a web application, and the team is actively seeking feedback to improve usability: https://my-nprint.web.app/
For our next step, Dr. Yushu Xia, a Lamont Assistant Professor at Columbia University and a Research Fellow in the Data Group, will lead a meta-analysis paper. The paper aims to synthesize key nitrogen indicators and datasets relevant to anthropogenic activities at the global scale, identify critical gaps and limitations in existing nitrogen data and metadata for applications in NAPs, nitrogen footprint assessments, modeling and MRV, as well as decision-making in management and policy contexts. We also aim to disseminate the synthesized results from this work to strengthen community-based collaboration. To achieve this, we plan to engage targeted stakeholder groups to identify priorities for improving data accessibility and standardization, which will allow them to help us co-develop actionable research and implementation pathways. This work will be built on the Data Dashboard led by iN-Net’s Data Manager, Margaux Alfare, who has summarized large-scale nitrogen datasets and their sources and is working on visualizing these datasets. We will further strengthen this process by incorporating stakeholder feedback, which will be gathered through surveys to improve both the database and the visualization tool.
The Data Working Group is currently organized into two subgroups: the Data and Indicator Group and the Stakeholder Engagement and Application Group. The Data and Indicator Group will focus on refining selection criteria for nitrogen indicators and datasets and leveraging the Data Dashboard and partner nitrogen networks to generate a global nitrogen database. This subgroup will also identify overlaps among datasets, compile metadata, and establish harmonization protocols. The Stakeholder Engagement and Application Group will link datasets and indicators to practical applications while designing strategies to gather feedback from policymakers, modelers, and environmental organizations regarding the dashboard. The subgroup will also aim to identify data gaps and assess potential uses of the data across various applications.